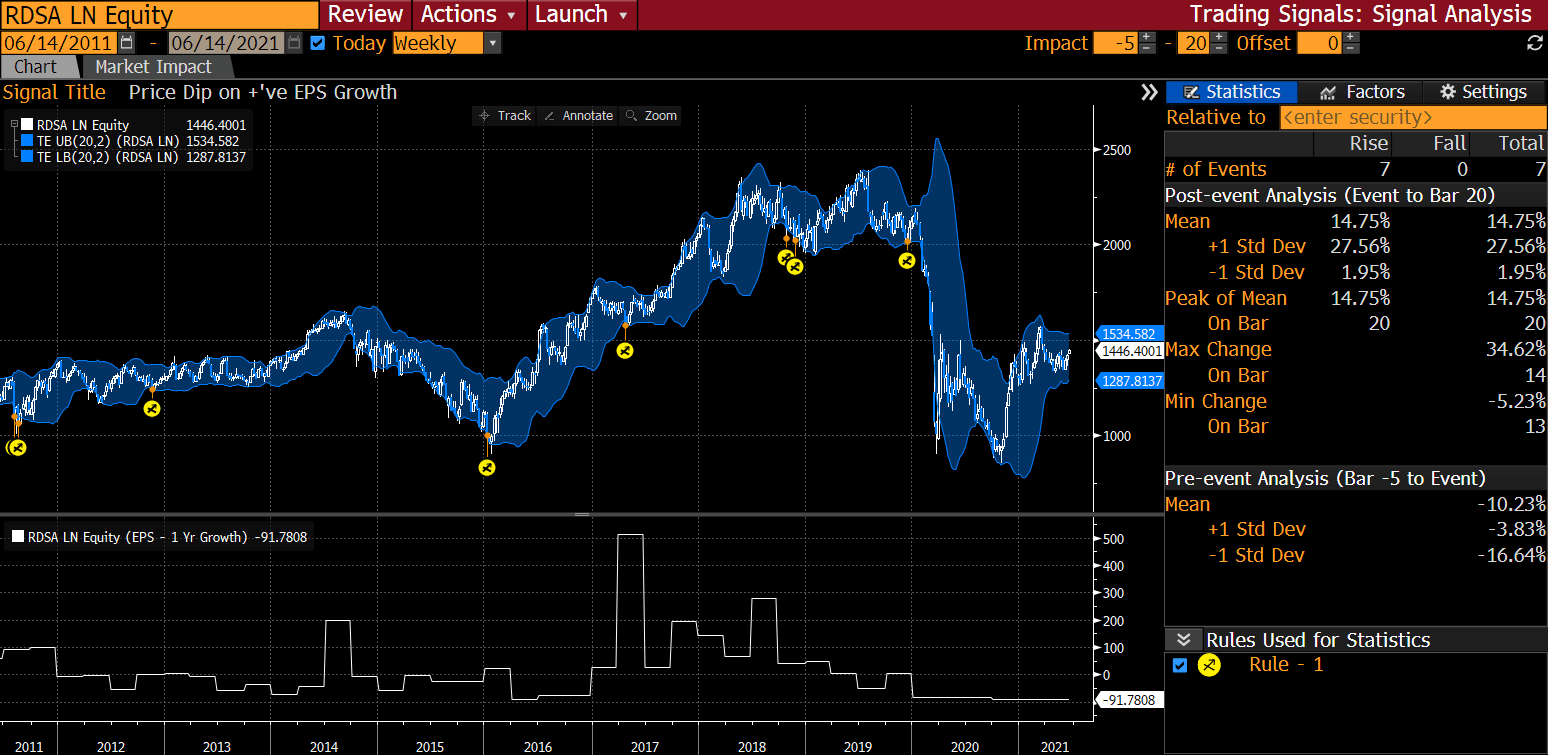
Our trading signals platform, TSIG <GO>, allows you to test a thesis. Enter your conditions and the tool will provide you with historical instances where these conditions occurred and quick statistics around the performance thereafter. True, history doesn’t always repeat itself, but looking for historical trends across metrics, whether it’s fundamental, price action or alternative datasets, is one way to gauge potential relevance and quickly share with your audience why they should care.
On the left, the sample ticker RDSA LN Equity has shown seven instances over the last decade of weekly data where EPS one-year growth was positive alongside a significant pullback in price – a potential opportunity to gain entry into a seemingly strong name. 100% of the time (seven out of seven instances), the price appreciated over the following 20 weeks an average of 14.75%.